On 7 May, the UK went to the polls. When all the votes were counted, many looked to the dramatic changes in the Welsh and Scottish governments, as well as the parliamentary fallout from hundreds of smaller battles at the ballot box.
Although these battles give indirect hints to a wider political struggle, their direct consequences arrive straight to the doorsteps of citizens. For voters in England, these were discussions about bin collections, social care, and potholes. No two of these battles are alike, and in the eastern county of Norfolk, a few maps have hidden some big changes.
Given that the national press has other priorities, only graphing results on a county level, and the local paper has not visualised them at all, this map became the headline of the local elections in the area:
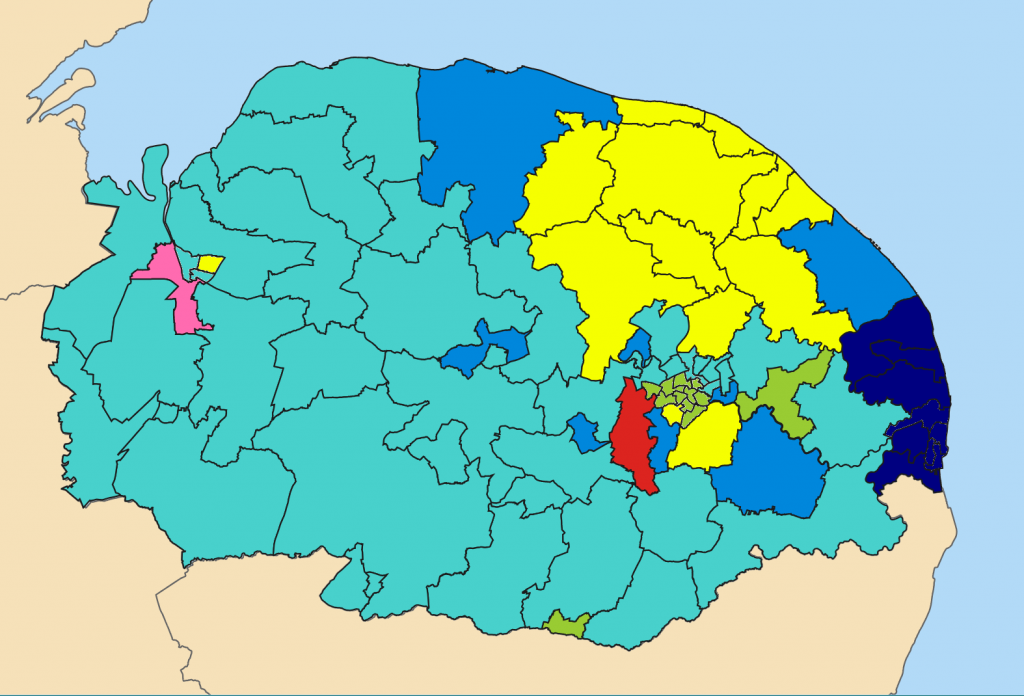
However, this hides the true multi-polarity of May’s vote. Here, I’ve done my best to get deeper into the numbers, and add some context to the area I know best, and the changes happening there.
All the below maps can be clicked to be enlarged. All were made by me, using R and RStudio. If you would like to use these maps or numbers for a good cause, feel free to get in touch.
The winners, visualised
Norfolk is a geographically diverse county. In the the south-west, The Brecks district spans almost 18 miles (29km), covering dense woodland and barren military training areas. In Norwich, the county town, the most industrious wards cover just over one mile (almost 2km).
The below maps represent each electoral ward as having an equal size, matching their equal electoral power and roughly equivalent populations. Because of this, some are adrift from their physical locations.

In Norfolk, most wards contain 8,000-9,000 voters. The most populous, Guiltcross, has more than 11,000 voters, several hundred above the second-most populous. The least populous wards lie in the city of Norwich, where smaller areas cover faster-growing neighbourhoods expected to move closer to average in years to come.
These smaller areas hold the same power as the largest, and are therefore under-represented on the Council-made map. Showing the winners using this hexagon map gives a better picture of the balance of power in the county.
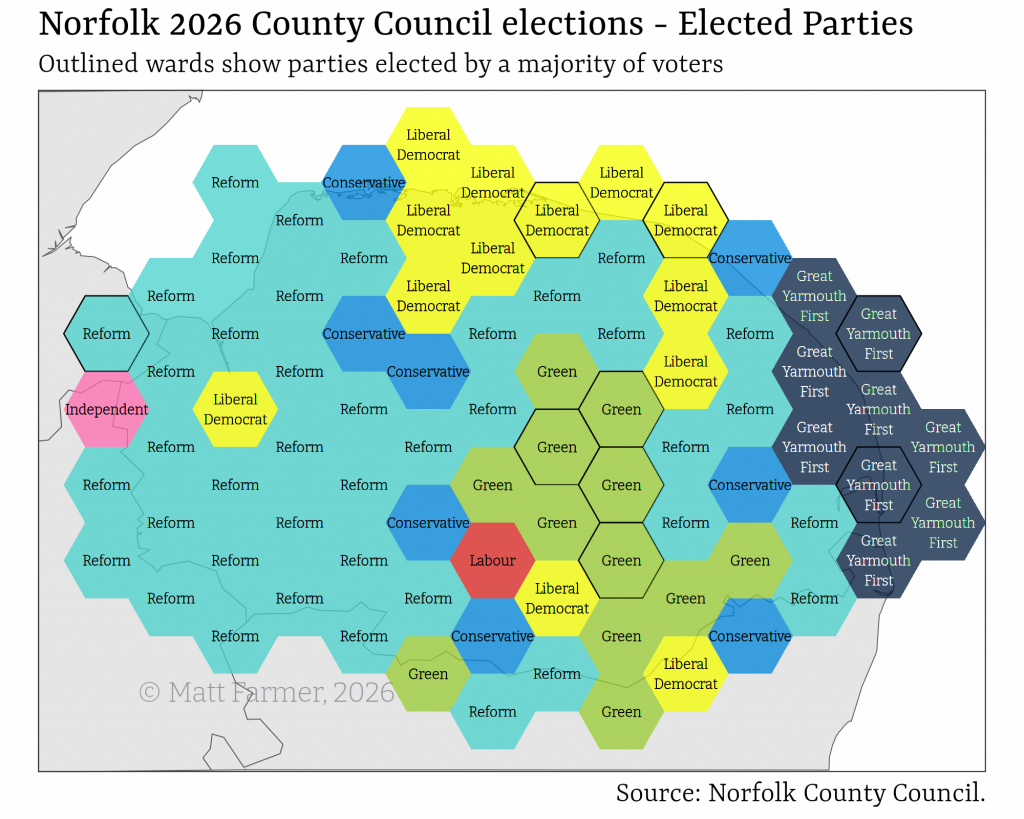
This map is simpler, but shows the more complicated nature of the county’s politics. While the wins for Great Yarmouth First and the Green Party cover small areas on a map, they will play a big role in the upcoming council sessions. Both of these parties took fewer seats than the Liberal Democrats, who maintained their traditional stronghold in the north of the county without much concern for wider trends.
In this election, the most radical change was Reform’s capture of 38 council seats, rising from just two seats in the previous session. Their campaign often focussed on dissatisfaction with the national Labour government, which lost a huge number of councillors across the country.
But in Norfolk, Labour’s pre-election total of nine seats was hardly influential in party voting. Today, their eight lost seats see, minimal compared to those of the Conservatives, who saw their seats fall from 53 to eight.
This election was fought in different ward boundaries to the last one, making a direct comparison of how areas voted unfair to all involved. However, the number of seats up for election remained the same, and the scale of the Conservatives’ losses has left the council with no party holding outright control over decisions.

While this graph shows the massive shift in council control, the full story is more complicated, and analysing this turquoise surge tells many smaller stories.
The Conservatives loss of 45 wards, more than half of the council, implies a total collapse in the number of Conservative votes similar to that seen in the 2024 parliamentary election. However, this is simply not true.
While the Conservatives definitely lost votes, with not much reason to be “very proud” of their results, the raw totals of votes across the county shows that Reform’s victory is not as overwhelming as it may at first seem.
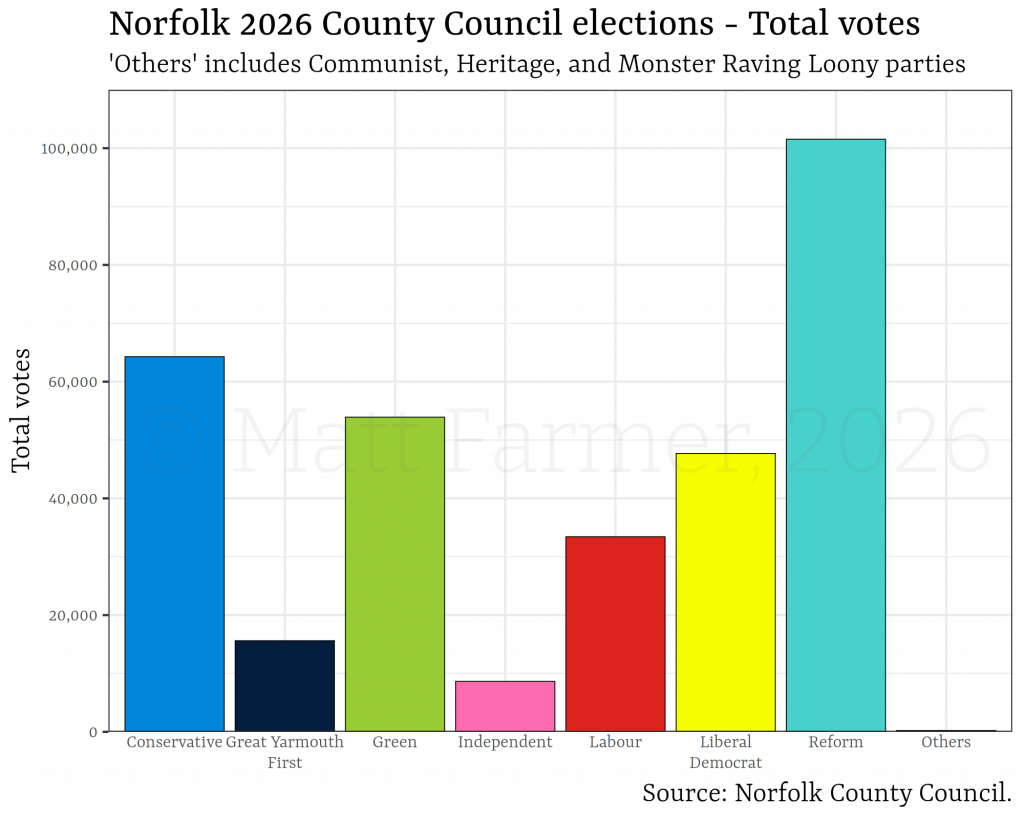
Reform took 101,536 votes in these council elections. The second-most supported party was the Conservatives who received 37,266 fewer votes, for a county total of 64,270. This is a significant margin in a council election; a difference representing 11.4% of total votes.
However, this means a 5.7% swing from Reform to Tory would reverse the result. In terms of the total electorate, this reversal could come by changing the votes of only 2.6% of all eligible Norfolk voters, making the Reform surge less robust than the councillors’ tally might suggest.
After the election, the leader of the Green party pointed to vote splits like those seen here as being evidence for the end of two-party dominance in British politics. Steady supporters of the Liberal Democrats would likely object to this description, as their party maintained a notable presence at the election, not far behind either the Greens or Conservatives.
The differences between party vote totals is certainly narrower than in previous years, and the reasons for this are nuanced. At different ends of the county, two wards tell a story of where power now lies, and why this election is very different to the conversations of parliamentary politics.
The East: Yarmouth Nelson & South Town
At the eastern end of the county, in an area close to the most eastern point in the UK, a local coalition made a big impact.
Great Yarmouth First (GYF) is the council party founded by Rupert Lowe, the MP for Great Yarmouth who was expelled from Reform nine months after his election. He then set up his own parliamentary party, followed by the local party that took nine seats in these local elections.
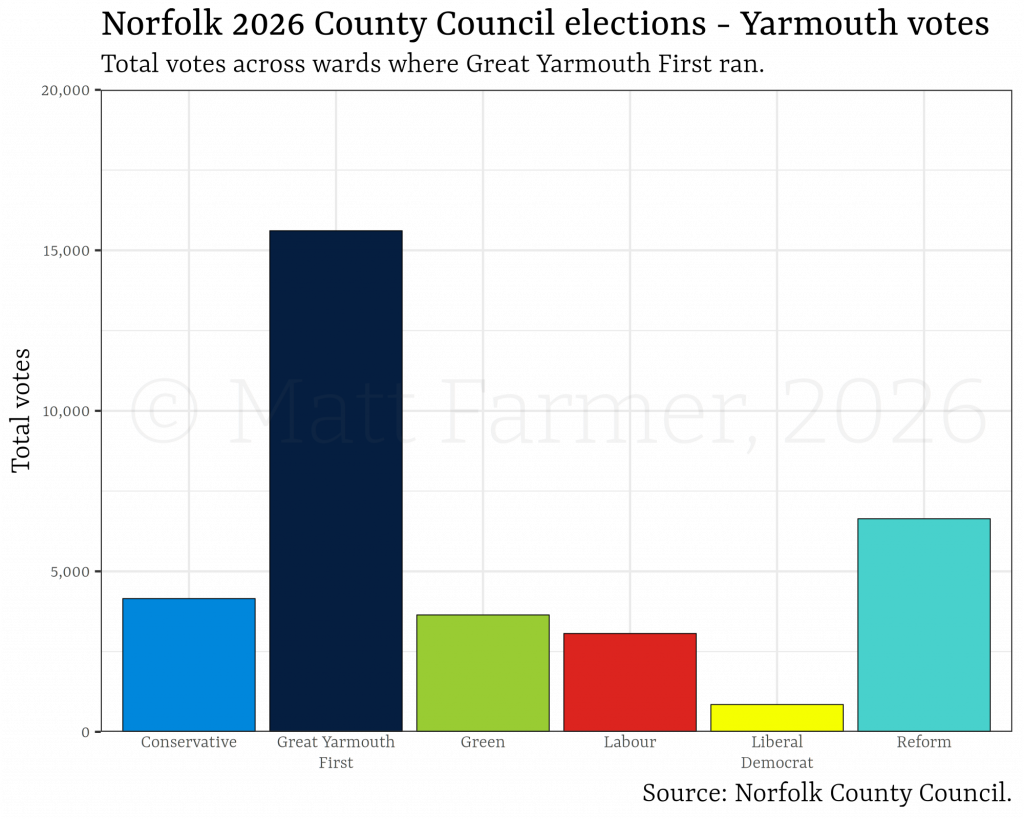
In the ward of Yarmouth Nelson & South Town, 35.3% of eligible voters voted. With 48.3% of the vote, they elected Callum Ward-Kendall for GYF, with 1,357 votes. Almost all wards where GYF ran saw Reform come second, but here the Greens came second, with 467 votes, with Reform coming third by just two votes.
Rupert Lowe’s Restore Britain party is intertwined with GYF. The MP chairs the council party, funds it, and publicises it. Publicity materials often describe the local and parliamentary parties interchangeably, and several policies are shared between the two, but the local elections saw a different focus.
Although GYF is an offshoot of a party that is itself a severed offshoot of Reform, it campaigned on local issues where other parties often spoke of national issues. While this reporter has not seen paper flyers distributed by GYF candidates, online material focusses on a range of issues within councillor’s control, including parking fees, high street commerce, and recycling rates.
These were frequently posted to the group’s social media pages, which were significantly more active than many of its competitors. While some of these competitors ran local-focussed campaigns, they often had a smaller online presence than GYF.
Leaflets from Reform, GYF’s closest competition, highlighted pledges to stop illegal migration or ousting Labour from national government, which lie outside of council powers. Social media campaigns were more varied, including comments about local opportunities and council-funded toilets, but tellingly, the party’s Norfolk website does not list any candidates, and only two of the links to local groups work.
A Facebook post by the Great Yarmouth Conservatives remarked on this: “What we’re seeing in Great Yarmouth right now is a deliberate attempt to blur the lines. Populist parties telling people that voting in a borough or county election will somehow ‘fix Westminster’, ‘sort immigration’, or ‘reset the country’. It won’t.
“A local councillor in Great Yarmouth does not set national policy. […] What parties like Reform and others are offering instead is protest politics dressed up as local representation.”
Although councils involve national parties and candidates may campaign on national issues, councils have almost no influence on national priorities. While the Conservatives highlighted this, they also frequently posted about the Mandelson scandal, an issue relating to national ambassadors far from the local area.
Wider issues
Councillors may campaign on national issues, but if elected, will spend their time deciding who takes the bins out, how potholes are filled, and where planning permissions will be granted.
Parties campaigning on national issues suggests an attempt to capture dissatisfaction with the national government, rather than concerns with how local services are delivered. The Green vote in Great Yarmouth could be interpreted as part of a national shift toward the extremes, as a vote for liberal policies, or as a vote against the dominance of far-right politics in the area.
Posts by GYF frequently mentioned the bad blood between Lowe and his former party, saying “Reform is no different from the rest of them“. However, the two parties share similar policies for national government, such as crime, often attributed to illegal migration.
In the run up to the election, posts by Lowe and GYF candidates stuck firmly to council issues, or were entirely without mention of policies. At all times, Lowe has repeated his maxim that “we will do what we were elected to do. Put Great Yarmouth First.” Given the area it represents, it would be difficult to do anything else.
Because of its high number of votes across a small number of wards, GYF now holds a disproportionately large amount of power on the council. On less than 5% of the vote, GYF now holds more seats than the Conservatives, who had more than four times more votes across the county.

This partly shows the “spoiler effect” of using the First Past The Post voting system. Running in a small number of seats, GYF was able to gain a higher share of seats than its share of votes, while the Conservatives and Labour earn very little for consistent second and third places in a large number of seats.
Lowe has said he “will work with anybody if it benefits the people of Great Yarmouth”. Despite the bitterness between GYF and Reform, the priorities of the parties often align, giving the larger party de-facto control of the council for its remaining term.
The West: King’s Lynn North & Central
Yarmouth Nelson & South Town saw the fifth-lowest turnout in the county, with the lowest being in the ward of King’s Lynn North & Central. Here, less than one-quarter of eligible voters voted.
The ward also had more candidates than anywhere else in the county, with seven names on the ballot. Reform won the seat with 37.6% of the vote, but no candidate received more than 1,000 votes in a ward of almost 8,000 eligible voters . This gives evidence to a second trend: Reform has a committed voter base that reliably voted across the county, but holds less power when more people vote.
Council elections always see relatively low numbers of eligible voters coming to the ballot box, a number known as turnout. The wards that saw a turnout of more than 50% lie almost exclusively in the east of the county, while the west saw much lower rates overall.

Norfolk is a relatively prosperous area. A higher-than-average age tells of the large numbers of retirees, while workers often find jobs in the agriculture, energy, minerals, creative or tourism sectors. This does not negate several considerably poorer areas, particularly in the county’s second- and third-largest towns, King’s Lynn and Great Yarmouth.
Of the seven wards with the lowest percentage of turnout, six cover parts of these towns. Reform did not win these areas at a significantly higher rate than their performance across the county, but its share of the votes was notably higher than average among them. In the 20 wards with the lowest turnout, 13 were also among the 20 wards with the highest share of Reform votes.
This not a strong correlation, but it is borne out by the numbers. In this election, it was also true, to a lesser extent, of Labour’s votes.
On the graphs below, every dot represents share of the vote won by the labelled party in a Norfolk ward in the recent election. The dashed lines represent a mathematical line of best fit, showing the trend across these 84 wards. Given the relatively small number of results, any conclusion taken here should not be seen as certain, or applicable on a national level.
These lines are surrounded by a grey confidence interval, marking where that line could also reasonably be placed. A wider confidence interval means the line is less certain, a narrower interval means greater certainty.
With turnout increasing toward the right and vote share increasing toward the top, a line ascending to the right suggests more voters means a higher share of votes for a party, while a descending line suggests that more voters in a ward means a lower share of the vote for the labelled party.
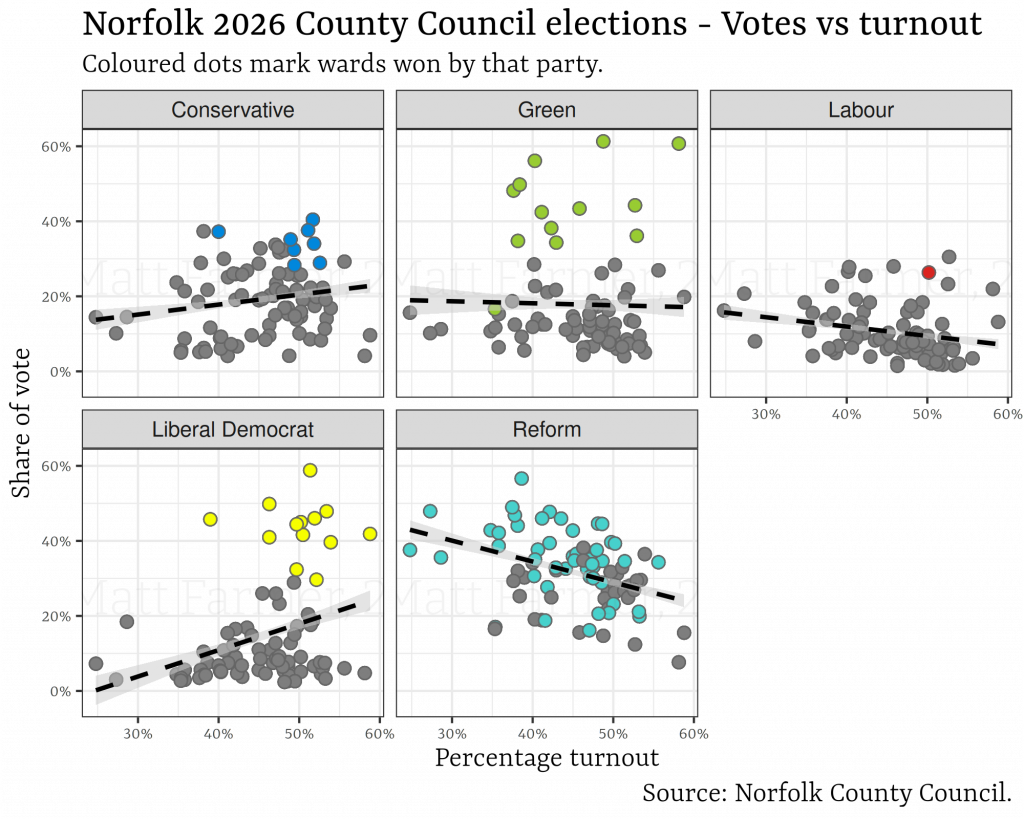
These graphs also show how effective seat targeting can be. In the 2024 general election, Reform took 14.3% of votes but only five seats, 0.8% of the total available. Because its vote was spread relatively evenly, the party rarely found itself on top of other parties that had a more uneven distribution of votes. In comparison, the Liberal Democrats took fewer votes in that election, but gained 14 times the seats.
The difference was targeting, where the party picked a few seats to focus on and ensured those passed the proverbial post. What happened at that election repeated here: the Liberal Democrats focussed on seats in North Norfolk and won them with a much greater share of the vote than it received elsewhere.
Green candidates enjoyed a similar success in the Norwich area, as can be seen by the blocks of coloured dots floating above the lower and more average level of support. On the other hand, Reform enjoys a generally higher level of support, winning seats without targeting them. This may seem like a strength, but it implies the party could win more seats if it better concentrated its efforts.
While it is an assumption, it seems logical to suggest that these results come a result of a consistent and widespread voter base that votes regardless of the general level of political engagement, and so does not scale up when other voters become more engaged.
This is critical, because while council elections give hints to national political trends, they are not the full story. There is at least one key difference with a national election: most of the electorate are disengaged from local politics.
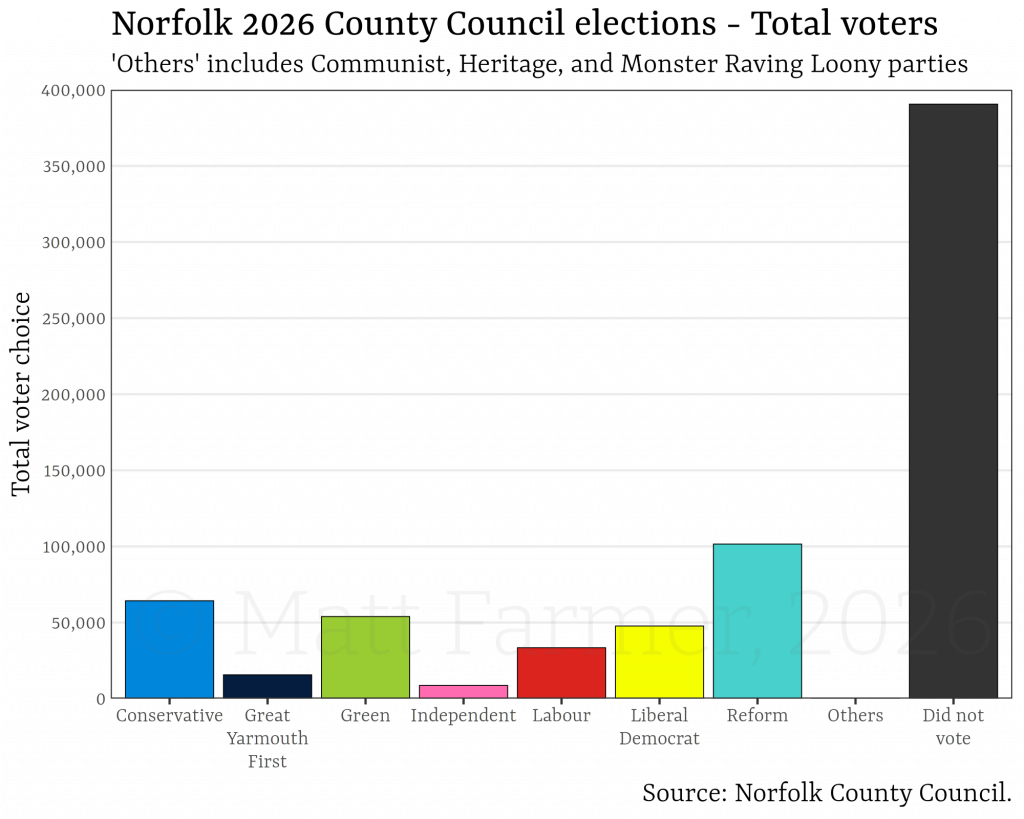
Ultimately, the largest voting bloc in this election was apathy. On the national level, some have described the increase in votes for Reform and the Greens as a form of protest vote, registering objection to the conventionally larger parties from people that would otherwise not vote.
In Norfolk’s 2026 election, there remained plenty of people who did not vote, though the total number of voters increased by approximately 90,000 from the equivalent election in 2021. As such, it seems that Reform voters do no benefit from apathy, but turn out to vote regardless of it.
Ultimately, the level of talk around the party, both nationally and in this article, comes because of its change of fates. In Norfolk County Council’s 2021 election, the party had three candidates and won no seats. Going into this election, it only had two seats, and as older parties know and have proven, elections, governance and stability are three different things.
Because it is early days for this insurgent party, and it is difficult to draw confident, statistically-backed conclusions from one election in a relatively small area, and using local elections to predict parliamentary elections ignores the vastly different scales of turnout between the two.
Local government systems are planned to be reorganised in 2027, recasting seven borough councils and one county council into three unitary authorities administering all the powers of the previous two-tier system. Reform has already pushed forward on previous Conservative objections, but if all proceeds as planned, the next set of elections are less than one year away.
Even these may transpire differently, but only time will tell, and only afterward will we have enough data to start drawing conclusions.